1. Open Google Sheets and highlight your data
In Google Sheets, select the range of cells that includes your category labels and corresponding values. For example, highlight A1:B6.
2. Click the Insert menu and choose Chart
Go to the top menu and click Insert, then select Chart from the dropdown. Google Sheets will auto-generate a chart based on your data.
3. Change the chart type to Bar chart
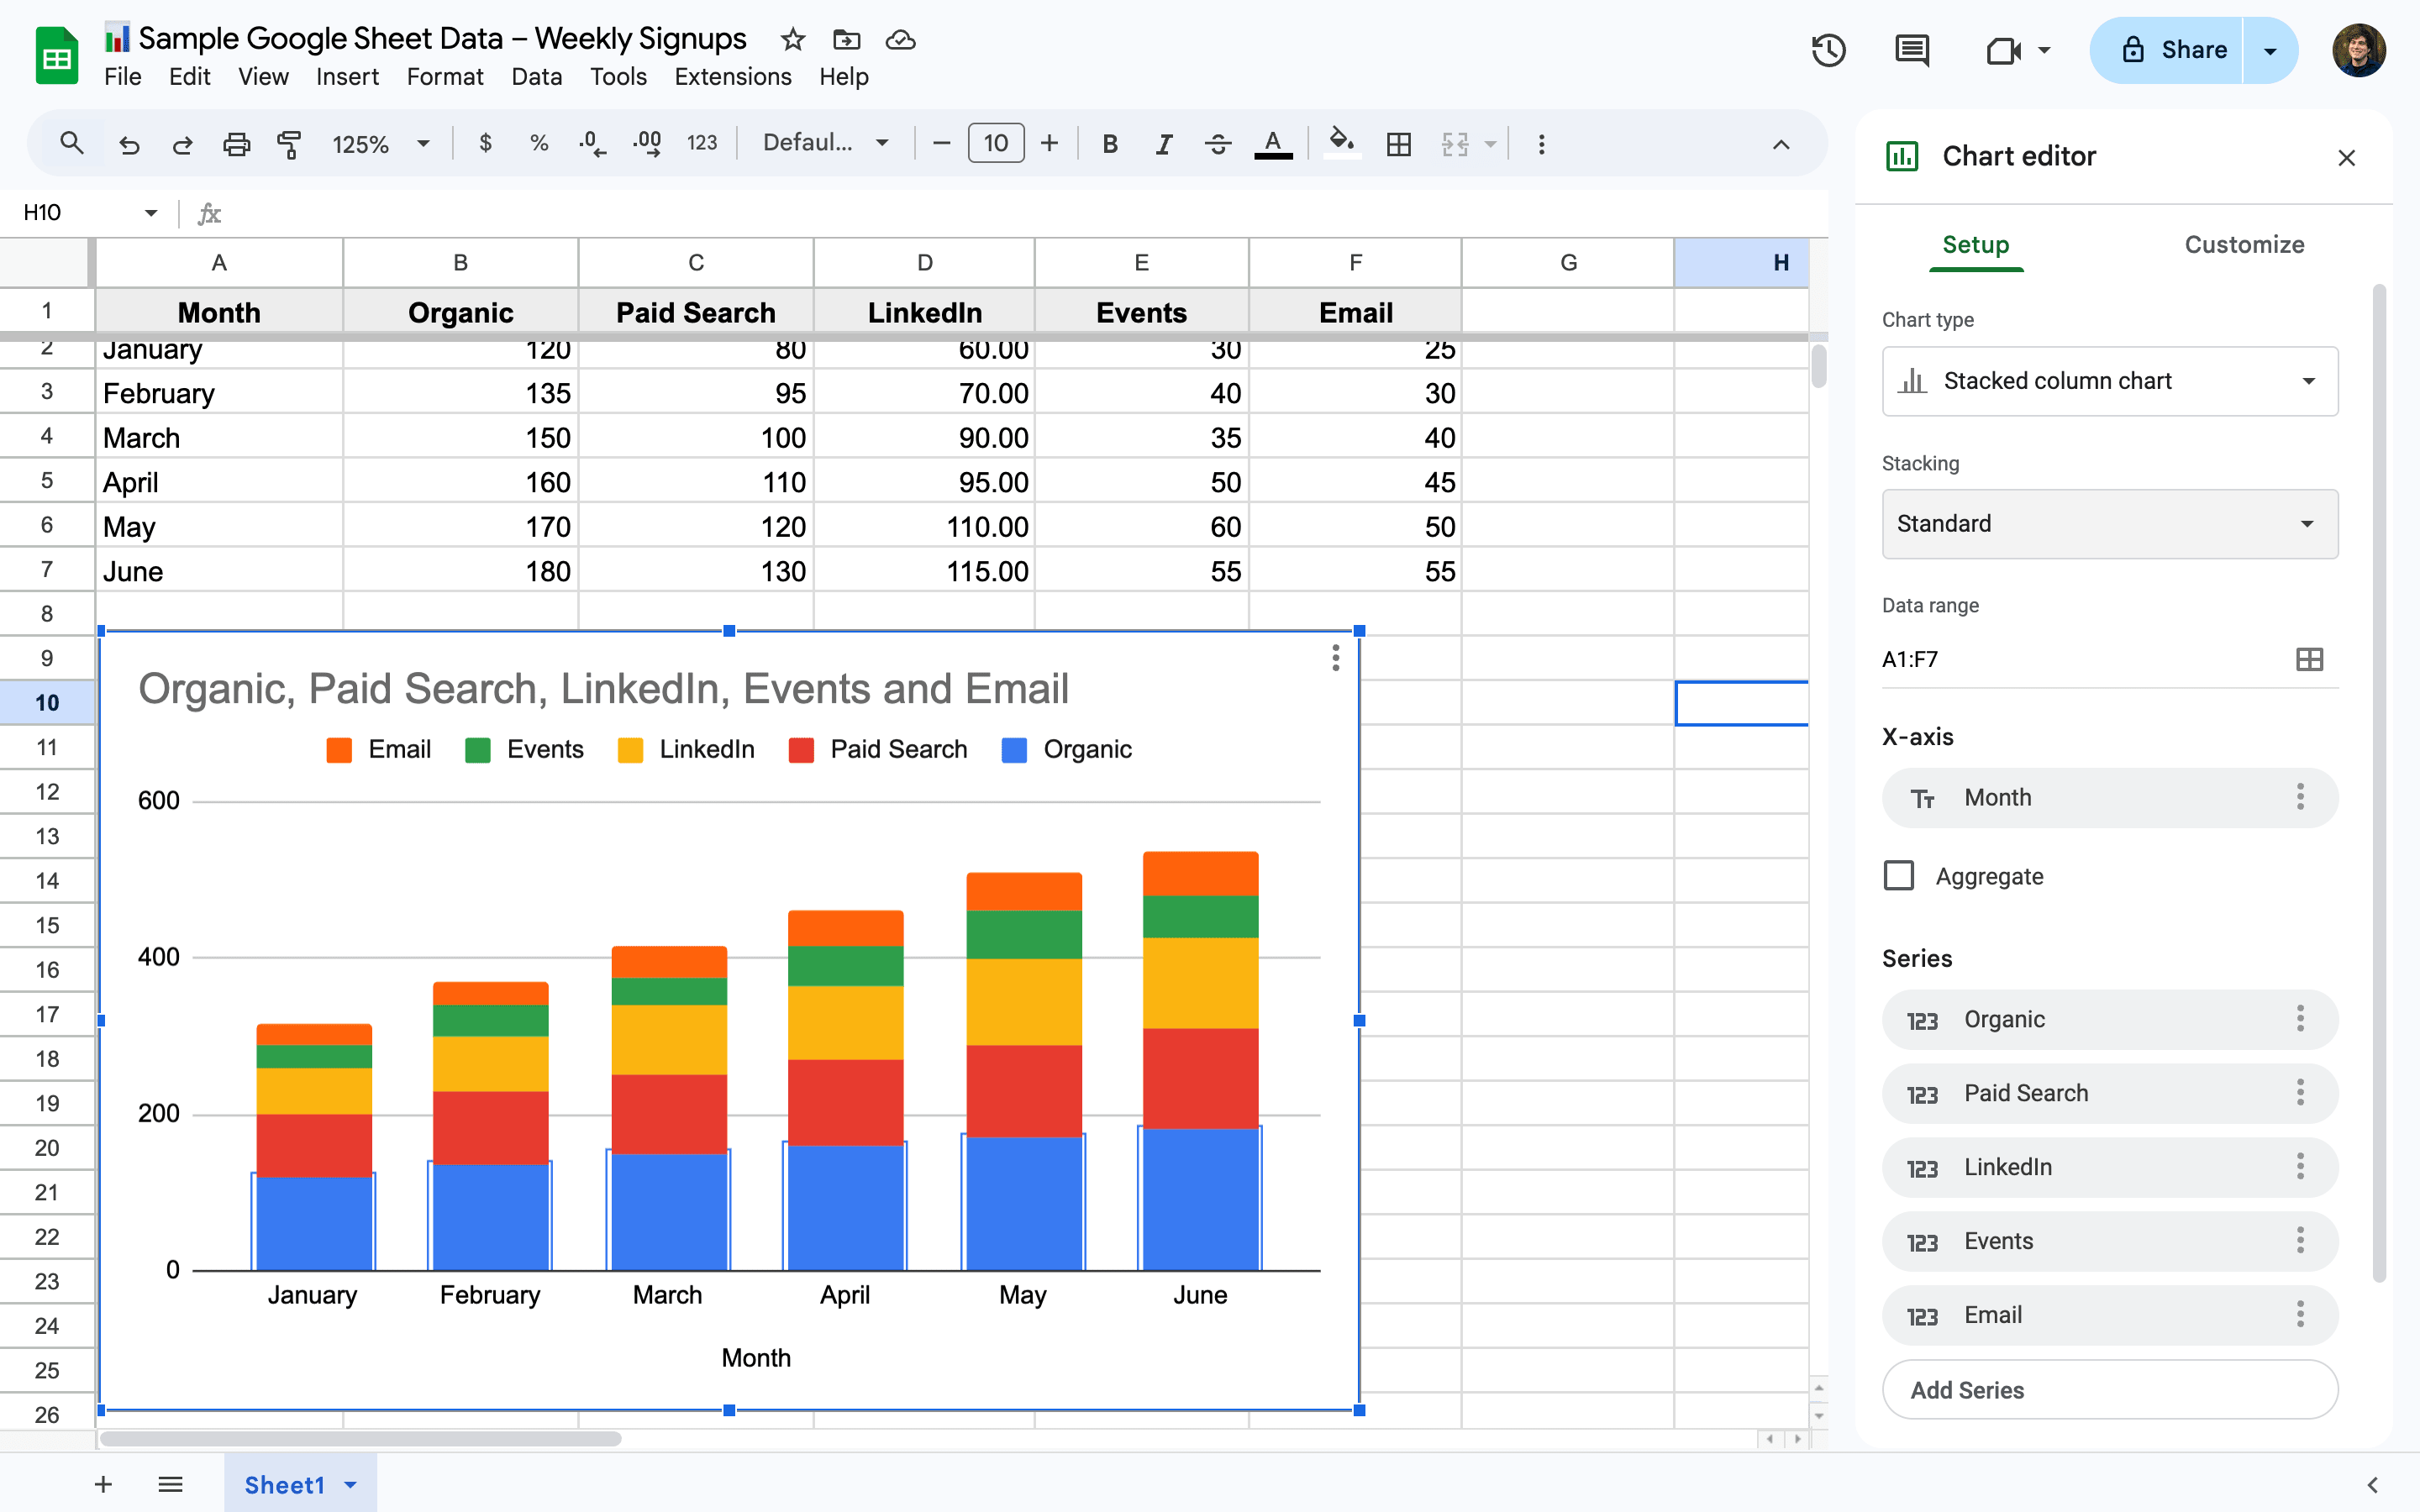
In the Chart Editor panel on the right, go to the Setup tab. Click the Chart type dropdown and select Bar chart under the "Bar" section.
4. Customize labels, colors, and legend
Switch to the Customize tab in the Chart Editor to adjust axis titles, bar colors, and whether to show or hide the Legend.
5. Resize and move the chart on your sheet
Click and drag the chart to reposition it, or pull the corners to resize it for better layout on your sheet.