A decade ago, having the best features could win you the market. Today, every category is saturated with capable solutions. Feature parity is table stakes, and what truly differentiates you now is the story you tell and how clearly you demonstrate value.
This shift has made product storytelling essential. The companies that win aren't necessarily building better software; they're building better narratives around their software. They're showing, not telling. And increasingly, they're doing it through interactive demos.
But here's the challenge: nearly every B2B software company now offers some way for prospects to experience their product before buying. Interactive demos have gone from competitive advantage to table stakes. The question is no longer whether to build demos, but how to build demos that actually convert.
To find out what works, we analyzed 14 million interactive demo sessions – studying completion rates, drop-off points, and the specific design choices that separate high-performing demos from the rest.
The clear takeaway? Engagement follows predictable patterns. Certain structures, pacing decisions, and storytelling techniques consistently outperform others. Below are the clearest findings from our analysis, along with what they mean for how you should build your own demos and define your approach to product storytelling.
At a Glance: The Perfect Interactive Product Demo Formula
Before we dive into the details, here's what the highest performers have in common:
- Keep it 9-12 steps. This is the sweet spot where demos are substantial enough to tell a complete story but tight enough to maintain attention.
- Use video to show motion and add a personal connection. The best demos include 1–3 short bursts of video. Use it to demonstrate complex interactions or put a human face to your product.
- Add AI-generated voiceover. A voice guiding users through creates a more personal, less effortful experience that keeps people engaged.
- Keep hotspots under 60 characters. Brevity forces clarity. If you can't explain a feature in a short phrase, your messaging needs work.
- Ask questions in your copy. Questions engage users mentally and make the experience feel like a conversation, not a lecture.
- Use emojis strategically. They add visual interest and emotional context when used with intention, not decoration.
- Front-load your best content. The data shows Step 7 is where most decide to bail. Show clear value early to avoid losing your viewer before they get to the end.
Let's unpack what's actually happening behind the findings, why they matter, and how you can apply the learnings to your own demos.
Demo Length Matters: The U-Shaped Completion Curve
"How long should my demo be?"
The data doesn't give us a simple answer – completion rates follow a curve that rises, falls, then rises again, suggesting that different demo lengths serve different user needs.
Here's what we found:
- 1-5 steps: 22% completion
- 6-8 steps: 32% completion
- 9-12 steps: 40% completion (initial peak)
- 13-15 steps: 37% completion
- 16-20 steps: 28% completion
- 21-30 steps: 40% completion (rebound)
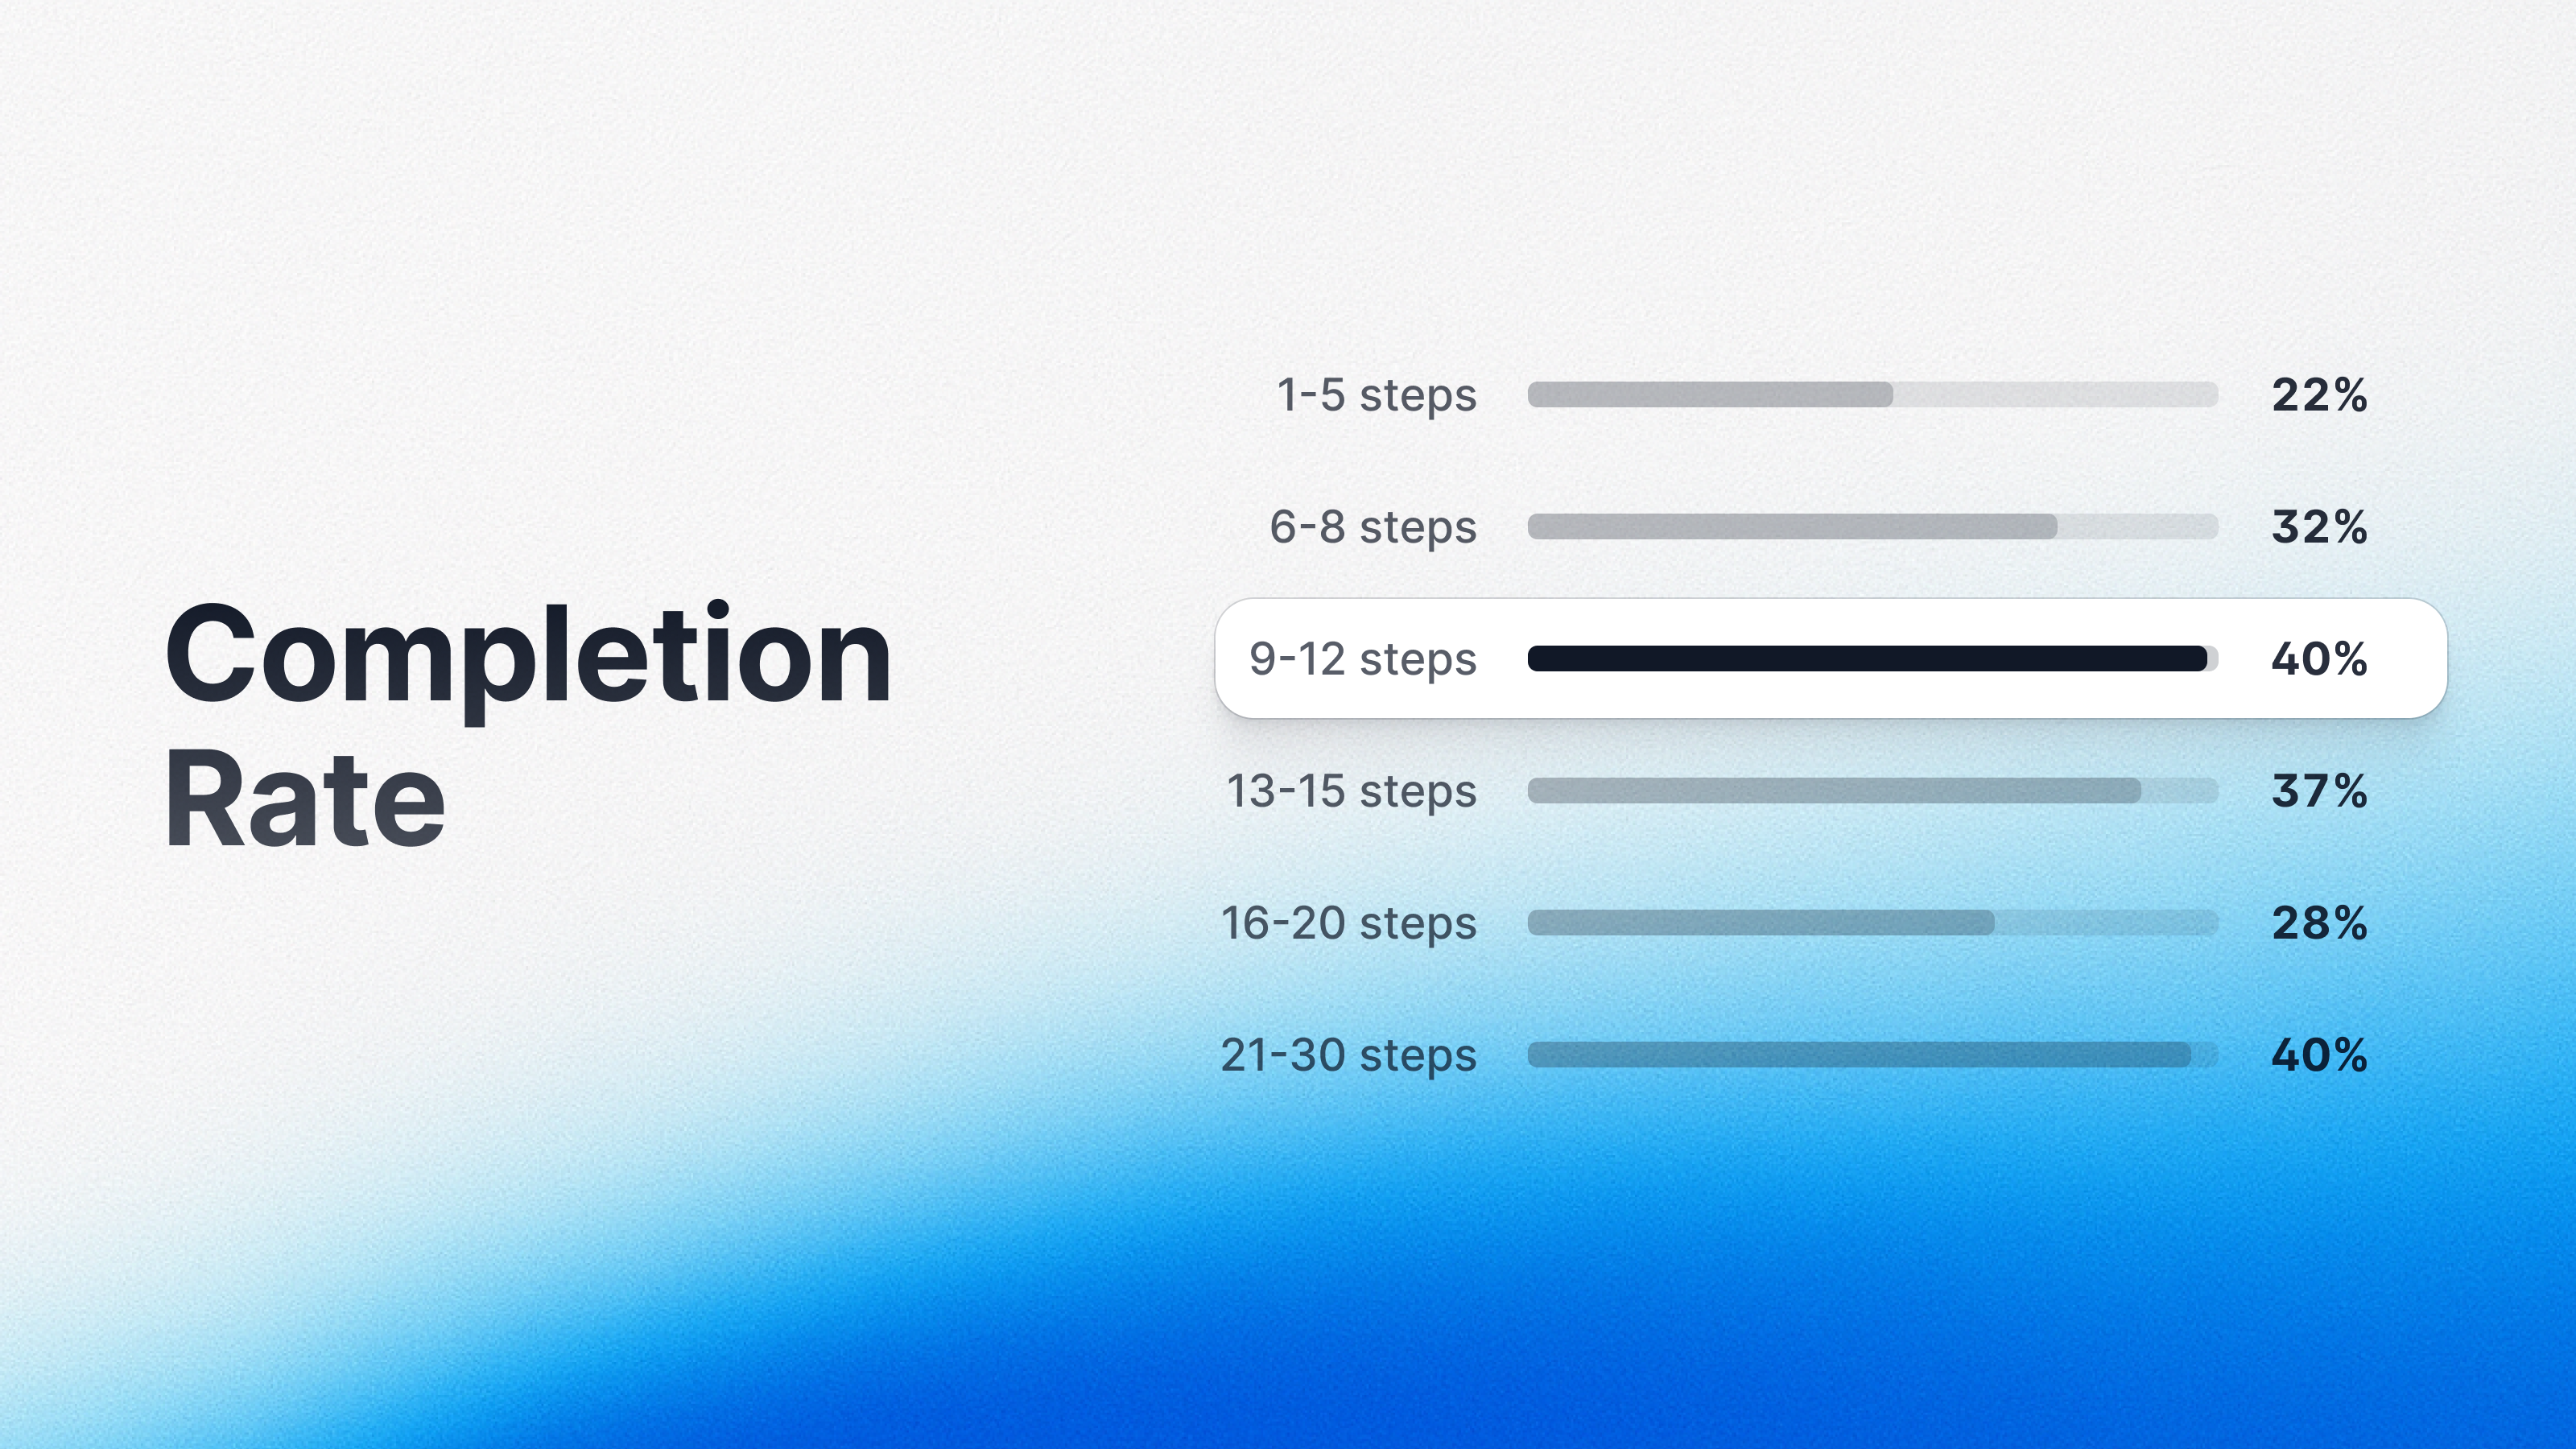
The headline finding: the 9–12 step sweet spot delivers an 84% higher completion rate than very short (1–5 step) Arcades. But the rebound at 21-30 steps reveals something important: different audiences engage with demos for different reasons.
What the Top Performers Show Us
Looking at the most-viewed Arcades in each bucket reveals distinct patterns:
In the 9-12 step range, the highest-performing demos (completion rates above 40%) tend to be tightly focused product walkthroughs. These Arcades serve evaluators who want to understand a product quickly without getting lost in detail.
In the 21-30 step range, standout performers achieve completion rates above 40% – matching the shorter demos – when users actively want depth. These longer demos are built to attract technical users, implementation teams, and power users who need comprehensive guidance through complex workflows.
The difference isn't just about length – it's about audience intent. Mid-length demos perform best for broad audiences in evaluation mode. Longer demos perform well when users are intentionally seeking depth and have already committed to learning the platform thoroughly.
The Critical Insight
Success comes down to aligning demo length with audience expectations. The 13–20 step range falls into an uncomfortable middle ground: too long for quick evaluators who want an overview, not comprehensive enough for deep learners who need detailed guidance. These demos ask for significant time investment without clearly justifying it to either audience.
The Practical Application
The real question shouldn't be "How long should my demo be?" but "What level of commitment does this demo assume?"
For broad audiences, aim for 9–12 steps. For technical evaluators and committed future-powerusers, build 20–30 step experiences that thoroughly demonstrate more complex workflows.
The Attention Cliff Before the Sweet Spot
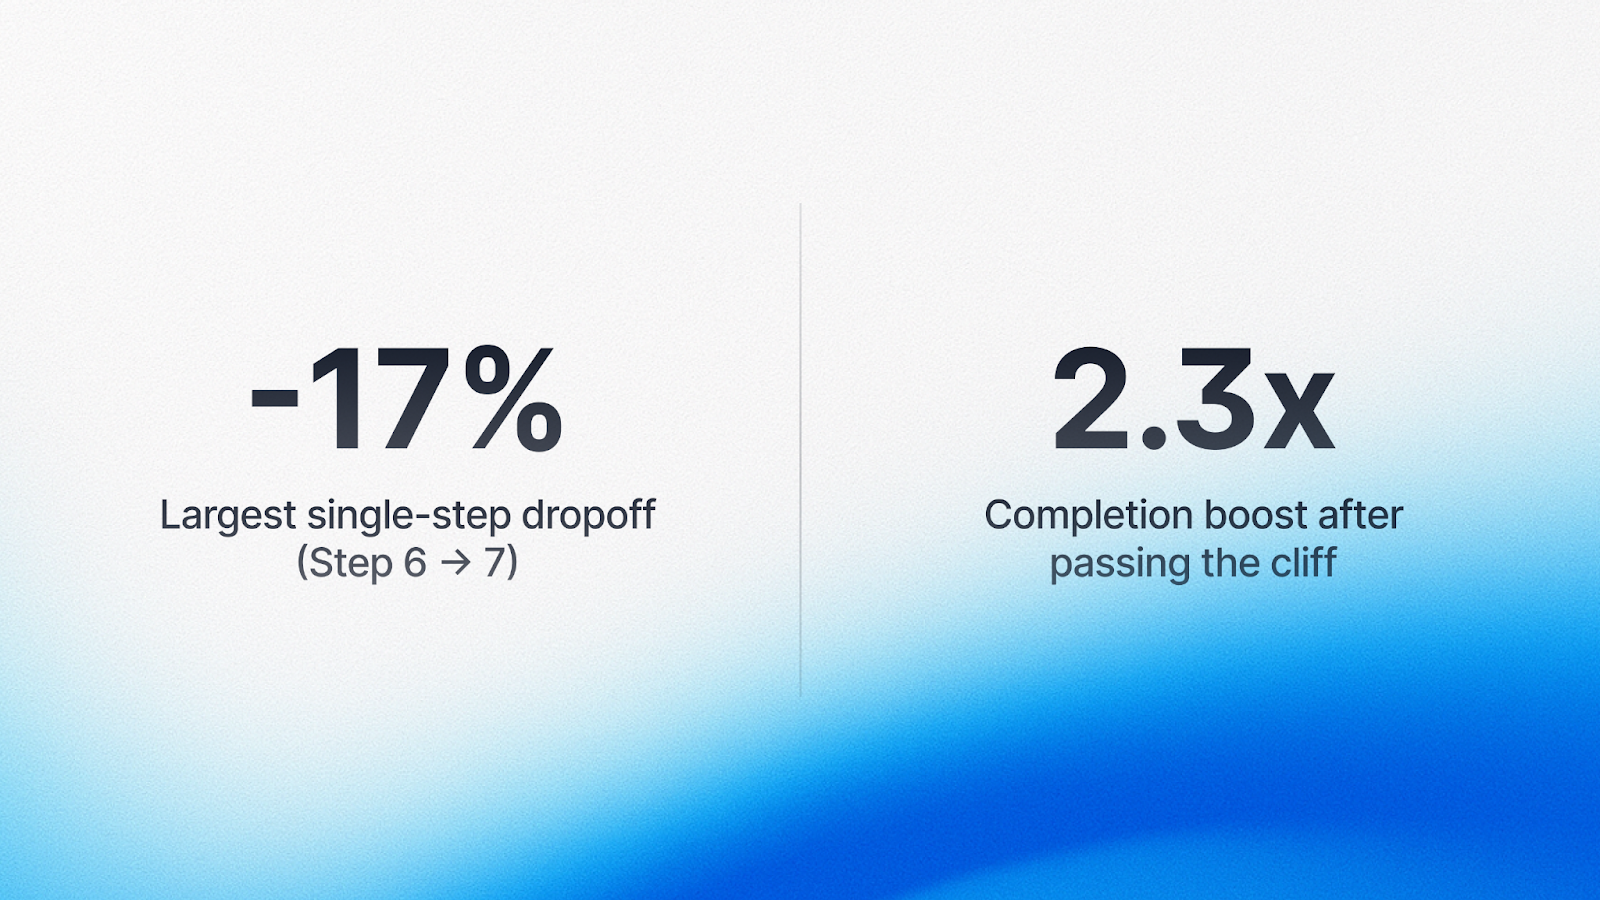
While the ideal demo length peaks at 9-12 steps, the biggest drop-off happens earlier. Step 7 is the cliff. Users who make it past step 7 are 2.3 times more likely to complete the entire Arcade.
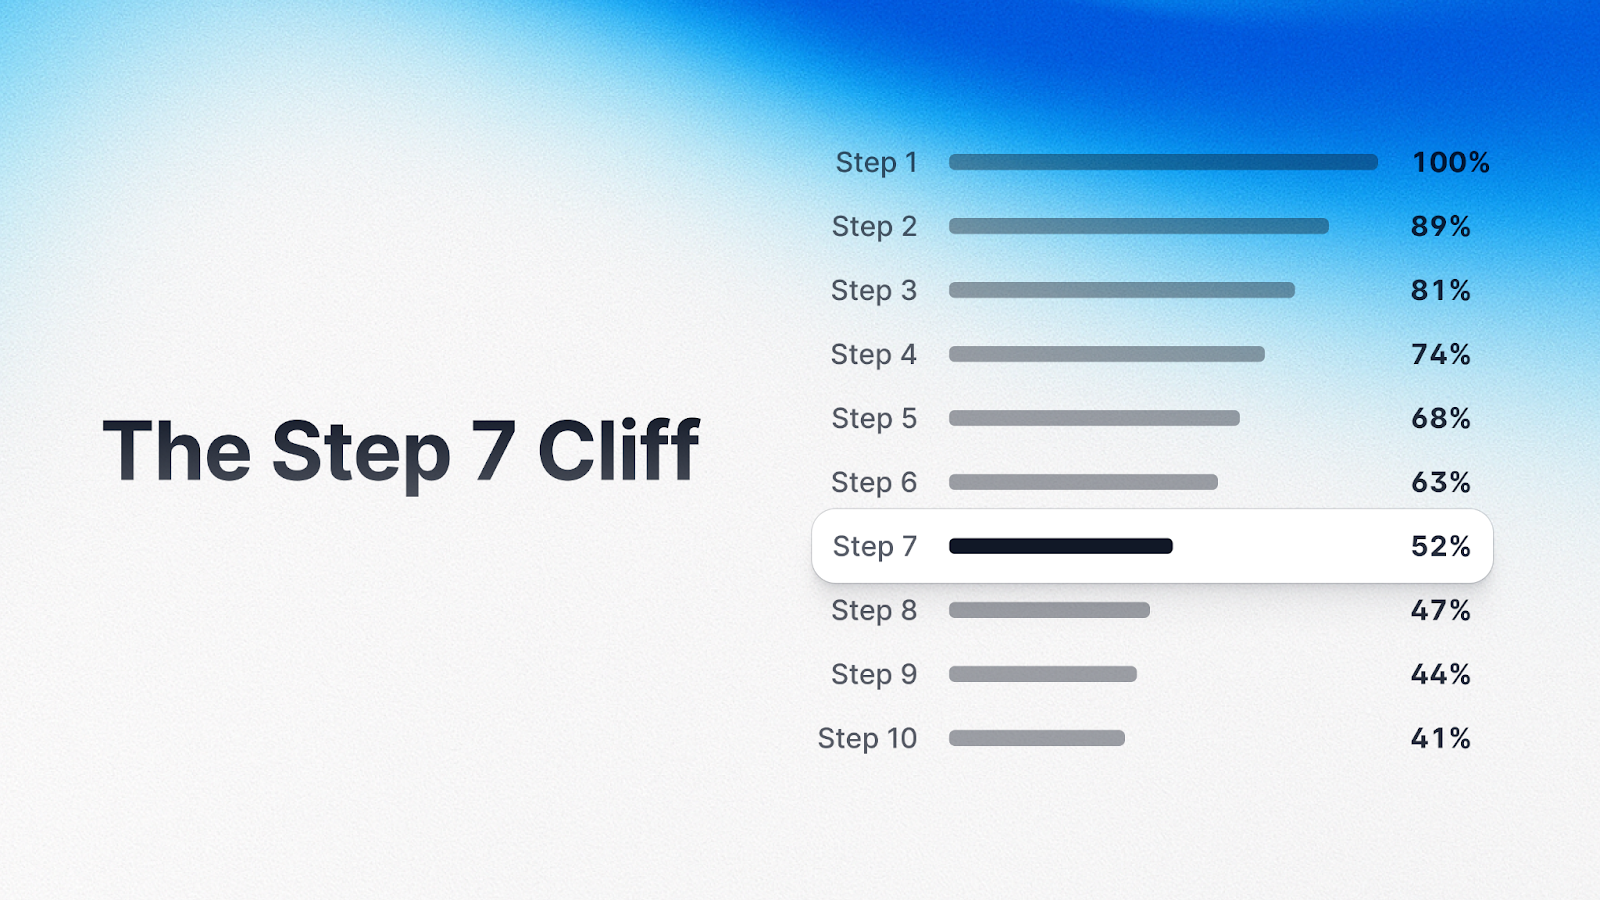
Think about what's happening in those first six steps. Users are making micro-decisions at every click: Is this relevant? Am I learning anything? By step 7, users who've made it this far have crossed a psychological threshold. They've invested enough time that completion feels achievable.
This explains why the 9-12 step sweet spot exists. Demos in this range structure their content to get users past the step 7 cliff and deliver the payoff in the remaining steps.
How This Fits Together
The relationship reveals the architecture of successful demos:
- Steps 1-6: Decision steps. This is where users decide whether to commit. Every interaction should build confidence and prove value.
- Steps 7-12: Payoff steps. Once users make it past step 7, they're committed. This is where you can go deeper.
- Steps 13+: Extended value. If you're going beyond 12 steps, make sure your audience has opted into depth.
The Practical Application
- Treat the first six steps as decision steps, not content delivery. Every interaction should answer: Why does this matter?
- Front-load relevance, context, and value. Don't bury your best content in steps 8-10. Lead with what matters most.
- Don't save your best content for last – many users won't get there. Win users early, then deliver deeper value once they're committed.
The Strategic Approach to Using Video in Interactive Demos
When it comes to video in interactive demos, the data tells a nuanced story. Image-heavy Arcades show higher average completion rates (~45%) compared to video-heavy demos (~36%). But this doesn't mean video is bad – it means video works best when it’s used intentionally.
What the Data Actually Shows
Looking at demos with 6-20 steps (controlled for length), we see a clear pattern:
- 0% video (image-only): 41% completion
- 1-15% video: 32% completion
- 16-30% video: 31% completion
- 31-50% video: 30% completion
- 51-100% video: 21% completion
You can (and we’d argue, should!) use video liberally – it can comprise up to half your content while maintaining steady completion rates.
The key is using video strategically as an accent that complements the broader narrative.
When Video Is Essential
Some content simply can't be captured in screenshots alone, and that's where video shines:
- Dynamic or AI-generated content. ChatGPT responses, AI generation, real-time data updates, or animations will of course require video. This is exactly what makes interactive demos powerful – the ability to show things in motion that static screenshots can't capture.
- Workflows best illustrated in motion. Process flows or sequences that unfold visually – such as drag and drop motions within the UI, or dashboard updates responding to user actions – are communicated better through video than through multiple static images.
- Personal connection using the camera. Demos that strategically use facecam video can build trust by delivering a more human experience. Some demos include a personal video step at the start (achieving completion rates above 55%), while tutorial-style demos use the camera throughout (reaching >60% completion).
Striking a Balanced Approach
The goal is to use video where it adds unique value. Think of it as a tool for specific jobs:
- Demonstrate motion, animations, and dynamic content (ie. AI-generated responses, real-time updates, workflow sequences, etc.)
- Add a human element by appearing on camera to provide a personal intro or more guided product walk-through
- Layer voice narration over video to guide attention and reduce cognitive load
Let screenshots with hotspots drive the interactive experience, and bring in video where it does something static images can't.
Moving the Story Forward with AI-Generated Voiceovers
AI-generated narration creates a measurably better demo experience. The technology is accessible, affordable, and easy to implement – and it drives tangible improvement in user engagement.
How Using Voice Upgrades the Interactive Demo Experience
- It reduces cognitive load. Voice narration frees up visual processing capacity. Users can listen while visually processing the interface.
- It keeps users moving forward. When voice narration is present, users progress through demos more smoothly. The data shows that demos with AI voiceover saw 14% higher completion rates.
- It feels more human. Even AI-generated voiceovers add personality that pure text lacks.
The Practical Application
Use voice as a complement to visual content, not a replacement. Keep it concise, match pacing to visual content, use it consistently, and always give users control to mute.
Word (and Emoji) Choice Matters
Copy choices had some of the largest single-variable lifts we observed. Small changes in how you write can dramatically affect whether users engage or drop off.
Asking Questions Earns More Clicks
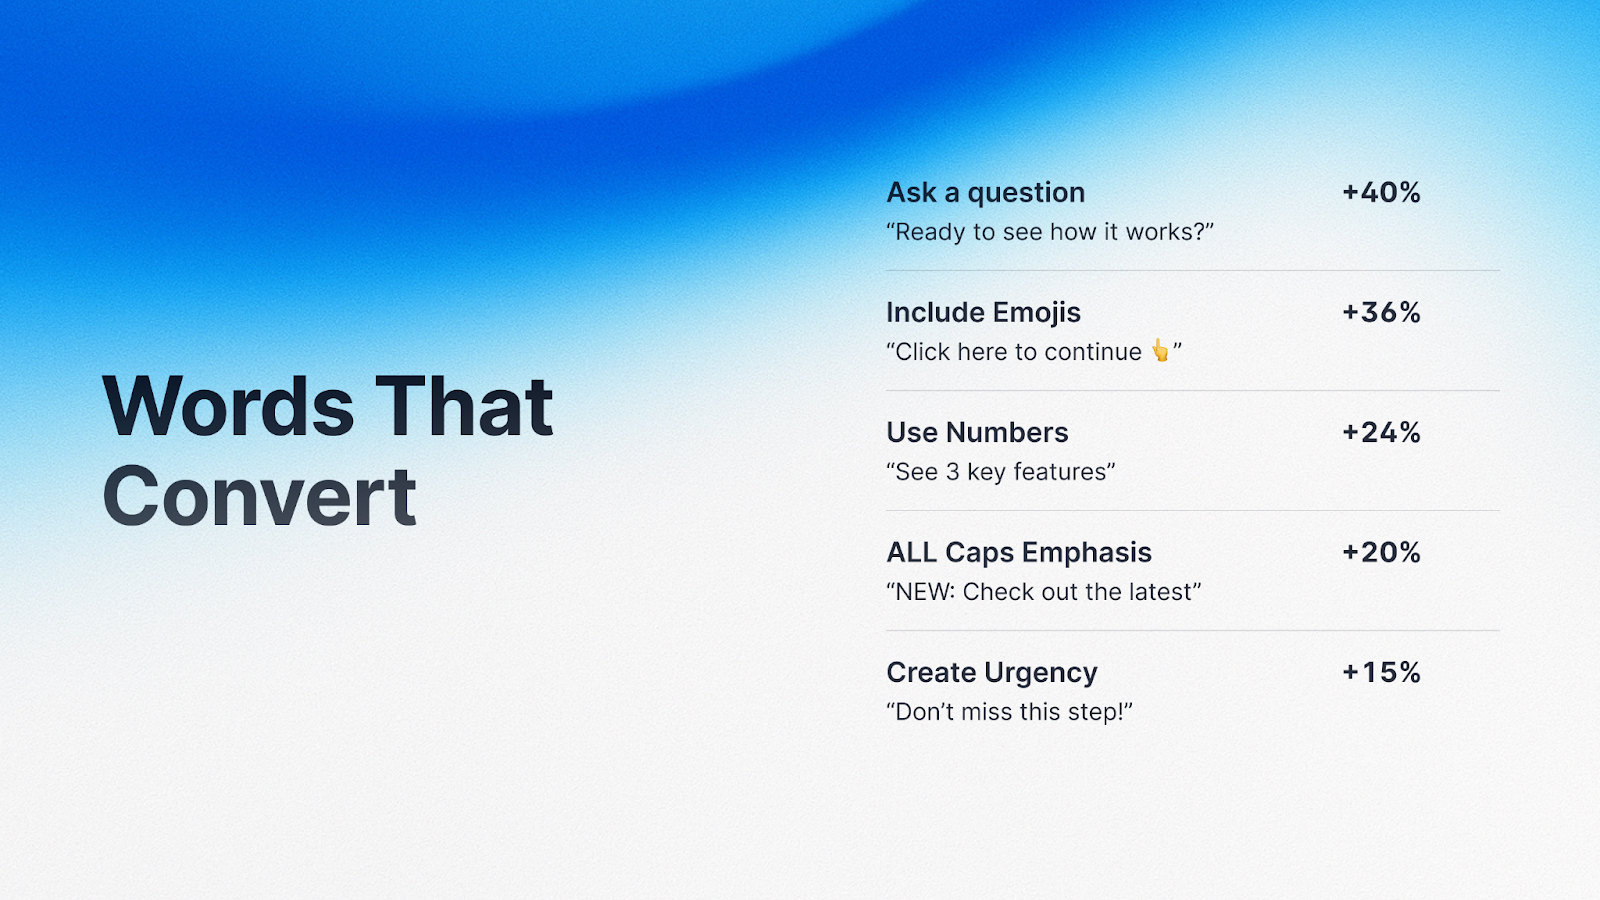
When hotspot labels posed questions instead of making statements, click rates jumped by nearly 40%. Questions create cognitive gaps that our brains instinctively want to fill. "Want to see how this saves time?" compels you to click. "This feature saves time" doesn't create the same pull.
Examples that work:
- "Want to see how teams save 10 hours per week?"
- "What happens when you automate this workflow?"
- "Ready to see how this integrates with your tools?"
Including Emojis Boosts Engagement
The highest-performing demos used emojis purposefully: as visual anchors (📊 for analytics, ⚡ for speed), to convey tone, and to create visual hierarchy. Emojis break up walls of text and communicate meaning faster than words alone.
Using Numbers Builds Credibility
Specific numbers significantly outperformed vague claims. "Reduce processing time by 47%" beats "Reduce processing time." Numbers provide concrete information that feels more trustworthy.
All-Caps Emphasis Captures Attention
Strategic use of all-caps for KEY WORDS boosted engagement by 20%. The key is moderation – one or two emphasized words per block of text.
Creating Urgency Keeps Viewers Moving
Language that created timeliness improved engagement: "See how this works right now" or "The fastest way to [achieve outcome]." This works best when the urgency is legitimate.
The Pattern Behind These Findings
These techniques help users decide what to do next, quickly. Questions create pull. Emojis aid scanning. Numbers build trust. In an interactive demo, every second of hesitation is an opportunity for users to drop off.
The Case for Concise Copy (Hint: Show, Don't Tell)
When it comes to copy length, the data is unambiguous: more text does not equal more clarity.
We found clear thresholds:
- Hotspot labels: 26-59 characters (under 60 is critical)
When hotspot copy exceeds 60 characters, completion rates drop by 12%.
Why Length Matters
- Concise copy keeps users moving. Users are making rapid micro-decisions. Every extra word increases the time and effort required.
- Long explanations signal complexity. Shorter copy signals that the experience will be quick and easy.
- Brevity forces clarity. When you have 50 characters, you have to identify the core message and strip away everything else.
The Practical Application
Audit your copy ruthlessly. Test before you add more explanation. Use visuals to communicate instead of text. Remember: in interactive demos, showing is more important than telling.
Some Demos Types Perform Better Than Others
We saw clear performance tiers:
Highest Completion Rates
- Action-oriented demos
- Question-based text
- Concise guides
Medium Completion Rates
- Feature tours
- Technical walkthroughs
Lowest Completion Rates
- Demos that lean on promotional language, jargon, and buzzwords
- Long-form demos that feel heavy-handed instead of interactive and exploratory
The difference comes down to focus. Top performers have a clear job to do, respect the user's intent, and are designed for the interactive medium. Low performers often repurpose content created for other formats.
The lesson: design for the format you're using. Embrace what makes interactive demos unique – user control, active exploration, and hands-on learning.
The Bottom Line
After analyzing 14 million high-performing interactive demos are the result of deliberate choices that align with how users actually engage.
You can implement these findings today:
- Create for the 9-12 step sweet spot when targeting broad audiences, or go deeper (20-30 steps) when users have opted into comprehensive learning
- Front-load value in the first six steps to get users past the Step 7 commitment cliff
- Prioritize images with hotspots over video to enable active rather than passive engagement
- Add AI-generated voiceover to reduce cognitive load and guide users smoothly
- Optimize your copy by asking questions, using emojis strategically, including specific numbers, and keeping everything concise
- Keep copy short – under 60 characters for hotspots, 50 for titles
- Build with focus – design demos that do one job well
The teams building the highest-performing Arcades understand: engagement peaks when demos are intentional. Every choice matters, from step count to media type to the specific words in a hotspot label.
Users commit early or not at all. Make those first six steps count. Active interaction beats passive consumption every time. And surprisingly small copy decisions create outsized impact on whether users engage or drop off.
The teams building high-performing product demo experiences are making deliberate choices, and now the data shows us exactly which of them work best to drive engagement and success.
Share on